Eve Christian, a friend of Bernard, is a meteorologist, journalist and general science writer, and can be heard on CBC radio. As her way of accompanying our hero on his voyage to the roof of the world, she explained the challenges and beauties of high-mountain meteorology.

Copyright ©1999, Eve Christian, all rights reserved.
www.meteo.org


Everest winds

The Roof of the World is at a height of 8,850 metres, or 29,035 feet. Moreover, it seems to be growing at a rate of 3 cm per year.

On the Tibet side of Everest, part of the landscape rises clearly above the surroundings. This “Tibetan Plateau,” from 100 to 1 000 metres above the surrounding countryside, is one of the largest and highest plateaus in the world. It rises 4 km above sea level and is “drawing nearer to the sky” at an estimated rate of 1cm per year. Chinese scientists think that some parts of the plateau are rising even more quickly–ten times faster than a million years ago, in fact.

An orographic feature as imposing as the Himalayas, or even the Rockies of North America, deflects the winds at different heights in the atmosphere. This has an impact on weather near Nepal, of course, but sometimes all around the world. The winds are forced to follow the mountain’s curvature by rising or sinking; in the case of Mount Everest, they deviate by more than 25,000 feet, to reach the height of the jet stream.

But what is this famous “jet stream”?

It is a region in the atmosphere where the winds reach their peak speeds. This current is usually located in the tropopause, at about 10,000 metres, but a jet stream can form in the lower levels of the atmosphere at night. These b winds generally flow from west to east over the mid-latitudes. To be called a jet stream, the winds must be at least 95km/h, but they can reach as much as 300km/h. The jet stream usually separates cold air in the north from warmer air in the south.Here’s an example from closer to home. When the winter is mild in southern Quebec, it is because the jet stream has shifted toward northern Canada. During a harsh winter, however, it is not unusual for the jet stream to move as far south as the Gulf of Mexico, bringing cold air to the central United States.

Inside the jet stream itself, there are often zones of higher winds. These zones play an important role in forming precipitation and depressions.

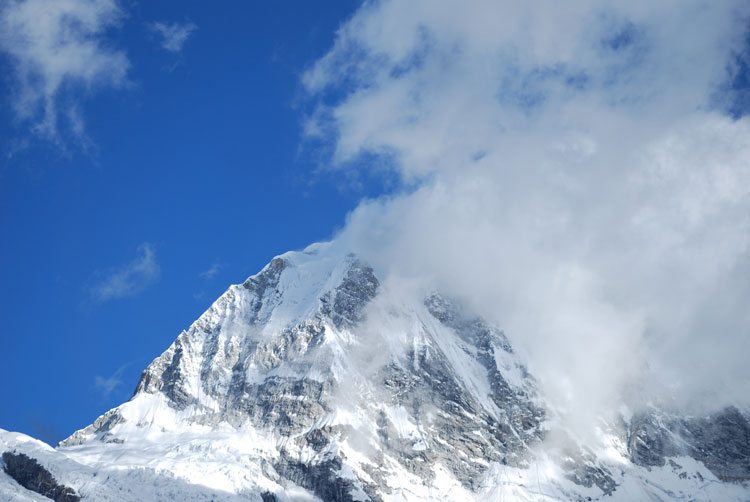
A jet stream blowing with the strength of a hurricane blasts the rocky, icy summit of Everest nearly all year long. Observers of the Roof of the World can tell when the jet stream is blowing there, in fact, from the long white stream of ice crystals extending out from the tip of the mountain. Those wishing to actually stand on the summit have to choose their moment carefully: the mountain is most inviting in early May, when the jet stream is pushed northward over Tibet by the arrival of the monsoon.

Bernard and his team have picked the best time to try their luck. So let’s wish them “kind” winds!


The “Cap” of Everest

Bernard and Dorjee may see some spectacular stratus clouds created by the particular orography of a high mountain like Everest. What are they, and how are they formed?

Nature truly offers an extraordinary spectacle for those who make it to the roof of the world.

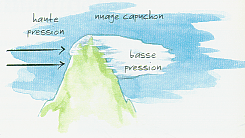
When the wind blows on a mountainside, an air bubble builds up, creating high pressure conditions on one side of the mountain. A low-pressure zone builds up on the other (lee) side in response.capimg

As everyone knows (right?), a low-pressure zone combined with sufficient moisture creates condensation and forms clouds. These stratus clouds, known as “cap clouds,” look as though they are attached to the peak of Everest.

Who knows, perhaps Bernard will be able to compare them with the cap clouds he sees over Mont Cervin in the Alps, or somewhere else in the world, on some future expedition…

Was it cold at the summit of Mount Everest at 8 850 metres in altitude?

This question has been asked hundreds of times to Bernard since he has reached the summit of the highest mountain on earth, on May 5th 1999. He answered us ” The temperature at the summit was approximately -25°C. This doesn’t seem very cold, but with the rarefaction of oxygen, it feels much colder. We never get to warm up. Our movements are very slow… and there is not enough place to jump…!!! At this altitude we inhale a large volume of air, and this air is very cold.

At the South col, at 8 000 metres in altitude at camp IV, it was colder than at the summit, approximately -35°C. Coming back from the summit, we have to spend the night at this camp. Tired out, exhausted, the cold is biting. Fortunately the satisfaction of having reached the summit warms my heart and soul.”


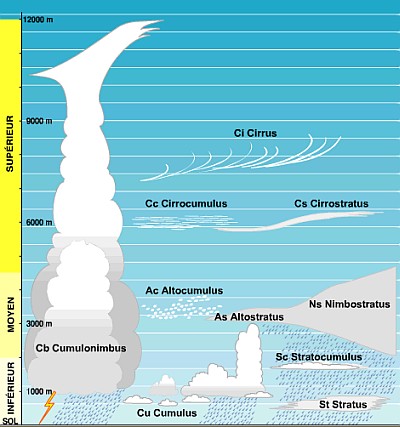
Various types of clouds

pic_nuages
 

Wind chill

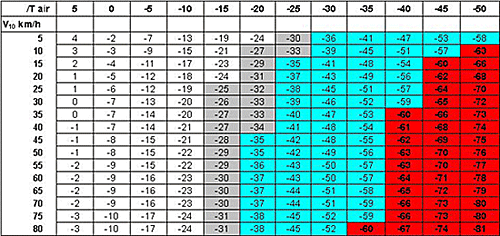
The National Weather Serve and the Meteorological Services of Canada use now a new formula to compute wind chill values. The new formula provides a more realistic wind chill value than the current formula, which has been in use since 1973 (base on 1945 research).

The wind chill index is computed hourly from National Weather Service reports of temperature and wind speed. The old index used the winds measured at an altitude of 10 metres where the winds are generally stronger. The new formula will use wind speeds taken at 10 metres high and reduce them to a 1,5 metres altitude speed. As a result, wind chill values obtained with the new formula are not as low at the ones calculated with the old index.


Wind chill calculation chart

tableau_meteo
  • T air = Actuel air temperature in °C
  • V10 = Wind speed at 10 mètres in km/h (as reported in weather observation)

Approximate Threshold:

  • Grey: Risk of frostbite in prolonged exposure.
  • Blue: Serious frostbite possible in less than 10 minutes (Shorter time if the skin is cool at the start).
  • Red: Serious frostbite possible in less than 2 minutes (Shorter time if the skin is cool at the start).
 

Temperature in altitude

The temperature below doesn’t take into account the wind chill.

Altitude (feet) above see levelAltitude (m) above see levelTemperature (°F)Temperature (°C)
0059.015.0
65620056.713.7
1 31240054.312.4
1 96960052.011.1
2 62580049.69.8
3 2811 00047.38.5
3 9371 20045.07.2
4 5931 40042.65.9
5 2501 60040.34.6
5 9061 80037.93.3
6 5622 00035.62.0
7 8742 40030.9-0.6
9 1872 80026.2-3.2
9 8433 00023.9-4.5
11 1553 40019.2-7.1
12 4683 80014.5-9.7
13 1244 00012.2-11.0
14 7654 5006.4-14.3
16 4055 0000.5-17.5
18 0445 500-5.4-20.8
19 6866 000-11.2-24.0
22 9677 000-22.9-30.5
26 2488 000-34.6-37.0
29 0358 850-45.4-43.0